1 Argentine Peso to Netherlands Antillean Guilder ( ARS to ANG)
| ARS/ANG | Sell (ANG) | Buy (ANG) | % |
|---|---|---|---|
| 1 ARS to ANG | 0.0020 | 0.0021 | -0.05% |
| 100 Argentine Pesos in Netherlands Antillean Guilders | 0.20 | 0.21 | |
| 200 ARS to ANG | 0.40 | 0.42 | |
| 250 ARS to ANG | 0.50 | 0.53 | |
| 300 ARS to ANG | 0.60 | 0.63 | |
| 400 ARS to ANG | 0.80 | 0.84 | |
| 500 ARS to ANG | 1.00 | 1.05 | |
| 600 ARS to ANG | 1.20 | 1.26 | |
| 700 ARS to ANG | 1.40 | 1.47 | |
| 750 ARS to ANG | 1.50 | 1.58 |
ARS to ANG Calculator
| Amount (ARS) | Sell (ANG) | Buy (ANG) | |
| Last Update: 25.04.2024 16:45:58 | |||
|---|---|---|---|
What is 1 Argentine Peso to Netherlands Antillean Guilder?
It is a currency conversion expression that how much one Argentine Peso is in Netherlands Antillean Guilders, also, it is known as 1 ARS to ANG in exchange markets.Is Argentine Peso stronger than Netherlands Antillean Guilder?
Let us check the result of the exchange rate between Argentine Peso and Netherlands Antillean Guilder to answer this question. How much is 1 Argentine Peso in Netherlands Antillean Guilders? The answer is 0.0021. Result of the exchange conversion is less than 1, so, Argentine Peso is NOT stronger than Netherlands Antillean Guilder. Netherlands Antillean Guilder is stronger than Argentine Peso..How do you write currency ARS and ANG?
ARS is the abbreviation of Argentine Peso. The plural version of Argentine Peso is Argentine Pesos.ANG is the abbreviation of Netherlands Antillean Guilder. The plural version of Netherlands Antillean Guilder is Netherlands Antillean Guilders.
How much do you sell Netherlands Antillean Guilders when you want to buy 1 Argentine Peso?.
When you want to buy Argentine Peso and sell Netherlands Antillean Guilders, you have to look at the ARS/ANG currency pair to learn rates of buy and sell. Exchangeconversions.com provides the most recent values of the exchange rates. Currency rates are updated each second when one or two of the currency are major ones. It is free and available for everone to track live-exchange rate values at exchangeconversions.com. The other currency pair results are updated per minute.
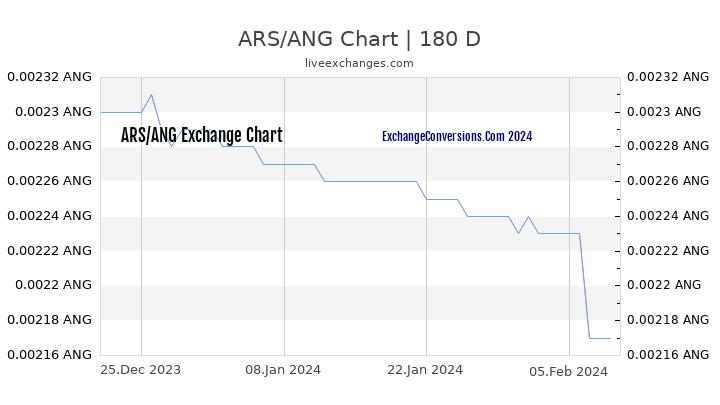
At chart page of the currency pair, there are historical charts for the ARS/ANG, available for up to 20-years.
Exchange pair calculator for ARS/ANG are also available, that calculates both bid and ask rates for the mid-market values. Buy/Sell rates might have difference with your trade platform according to offered spread in your account.
Exchange pair calculator for ARS/ANG are also available, that calculates both bid and ask rates for the mid-market values. Buy/Sell rates might have difference with your trade platform according to offered spread in your account.
ARS/ANG Chart